Meta Immersive Debugger Now Available - For Devs And Non-Devs!
Hello everyone! Today, I’d like to chat a bit about a new, incredibly useful tool available for anyone currently developing experiences for Meta devices. I say anyone because this new tool, called the “Immersive Debugger,” can literally be used by anyone with access to a Unity project—whether you're a designer, developer, project manager, it doesn’t matter. Immersive Debugger provides features that allow you to create in-headset inspectors, exposing built-in or custom component members to a runtime UI. But what does that really mean? Members? Runtime UI? Let me explain a bit further, and we can also compare how we used to do in-headset testing versus what we can do today.
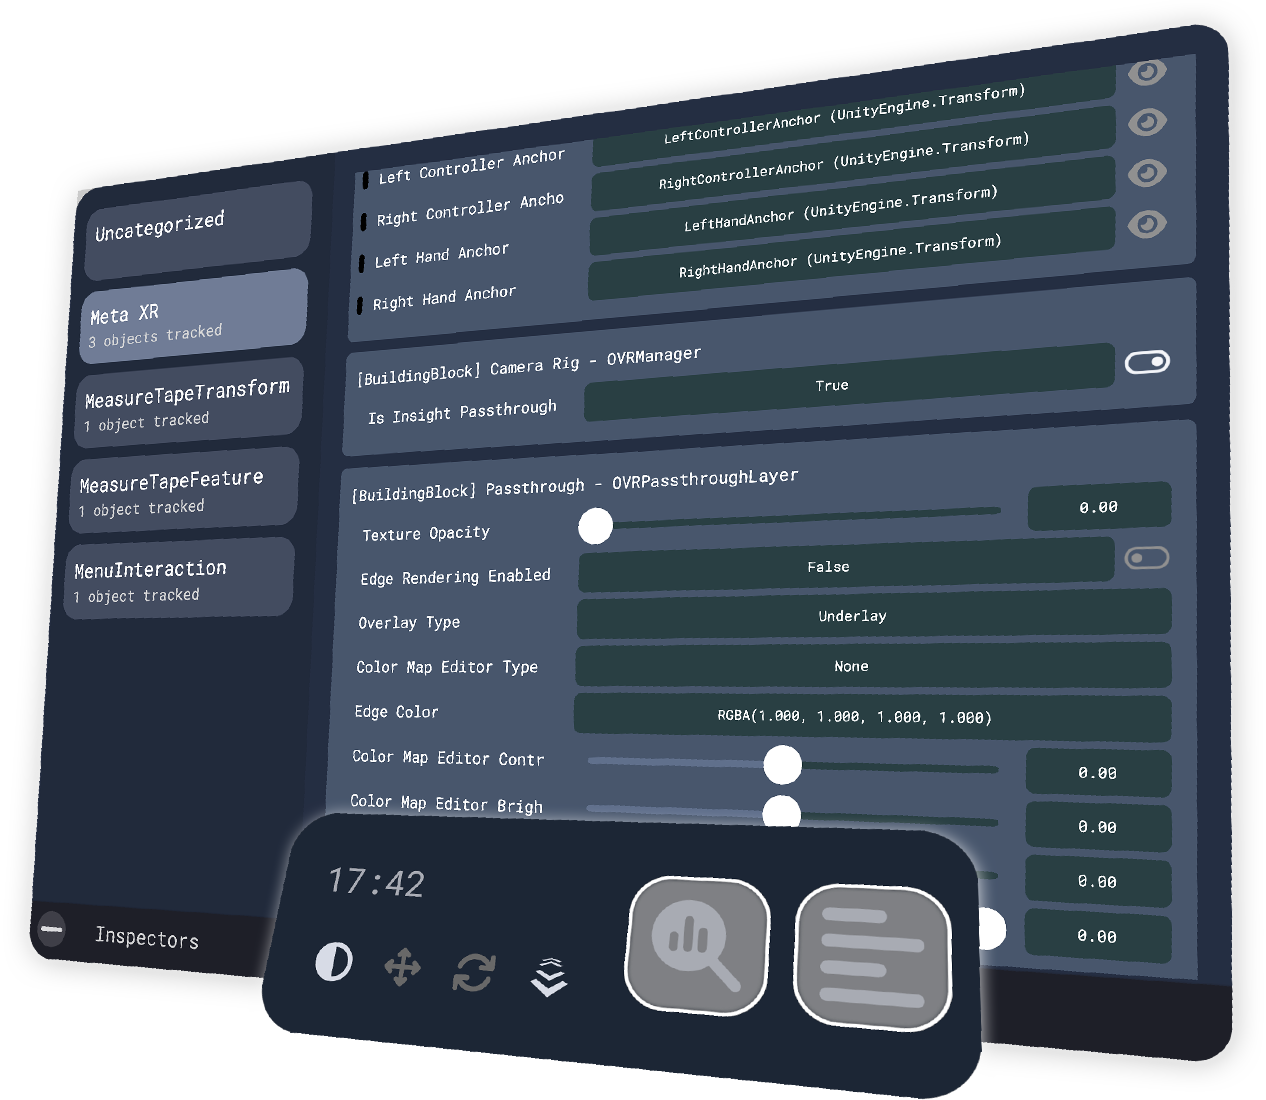
Fig 1.0 - Meta Immersive Inspector
Not too long ago, we could only test Unity Meta projects by deploying directly to a physical device or using Meta Link (aka Oculus Link). We’d write tons of `debug.log` entries wherever we thought the bug might be or attach the IDE debugger with breakpoints while running through Meta Link. Some of us had unit tests or custom tools to test our code, but in the end, there wasn’t really a standard solution. I know many people use Runtime Inspectors from the Unity Asset Store or custom ones to get more visibility into the hierarchy and custom components. Recently, Meta also released the Meta XR Simulator, which allows us to quickly test our apps by emulating a physical device and connecting Unity to it. We can use our keyboard or physical controllers to interact with the simulator, which is amazing and saves us a lot of time. But it's still not the whole picture. We still need to test with a physical device because our interactions, physical environments, and device OS differs significantly from a simulation.
This is where the Immersive Debugger comes into play. Meta recognized the need, and many devs thought of it too, but nothing really came out of those ideas (trust me, I was one of those devs who wanted to bring an OpenXR runtime debugger solution, but it didn’t happen due to time). We had custom tools that took us further, but they were custom, and there wasn’t a good standardization in place when moving from project to project. Or think about this: what if you were to move companies? Maybe you put those tools in a core library, but guess what—you can’t use them due to company policies. Custom solutions also require maintenance, which isn't something we want to focus on when working on a project, instead we need to focus on the app or game idea and leave the tools to the platform developers.
Immersive Debugger (Non-Devs)
This is the beauty of how this tool was designed: you do NOT need to know how to code to use it. You only need a basic understanding of Unity, and it’s so user-friendly that anyone with access to the project can start testing functionality before any UI is even created. You can troubleshoot issues without relying heavily on developers. In the end, it’s a brilliant solution that helps teams work faster and more efficiently. Let me show you an example of how this works behind the scenes by walking you through one of my projects.
In my latest YouTube video, I covered a variety of examples, including one that utilized a Productivity App I created while working on a new Mixed Reality development series. In that app, I have a custom Unity component called `MeasureTapeFeature.cs` which captures input from the Meta controller(s) to draw points. As you draw these points, it calculates the distance between them and provides measurements in both centimeters and inches. So, how do we set up the Immersive Debugger? And how can a non-developer expose variables, functions, or other implementations without touching the code? I'll be answering those questions next.
Immersive Debugger (Setup)

Fig 1.1 - Meta icon > Immersive Debugger
Follow these steps to set up the Meta Immersive Debugger in your new or existing project.
Install Meta XR All-In-One SDK or Meta XR Core SDK through Unity’s package manager
On the bottom right corner, click on the Meta icon > Immersive Debugger (see Fig 1.1)
Toggle the Enable option on and off for Immersive Debugger visibility
Go to File > Build Settings > Enable Development Build
This step is required, otherwise Immersive Debugger options won’t show. If you like this in production then review the Advance Usages from Meta’s documentation which describes what is needed.
Immersive Debugger (Non-Devs Overview)
Fig 1.2 - DebugInspector Unity component (part of Immersive Debugger)
As a non-developer, you can add a `Debug Inspector` component to any game object in Unity. This component automatically detects the game object's components and lets you toggle members on or off to expose them in a runtime inspector (see Fig 1.2 to see how this looks).
There are a few fundamental options available, but keep in mind that these options can vary depending on the member type.
Debug Gizmo: Similar to Unity’s built-in Gizmos, these rely on the underlying attribute type. For example, a `Vector3` variable with an `Axis` attribute will be displayed within the `Vector3` position.
Axis: displays a XYZ handle
Point: displays a small 3D dot
Line: allows you to display a line
Lines: similar to line but the source is a list of vectors
Plane: displays a plane
Cube, Top Center Box, and Box: displays exactly what their names suggest
Color: RGBA color selection displayed within the Runtime Inspector area panel
Tweakable: makes this type editable with a slider, and allows you to change this type value at runtime
Min: lowest value
Max: highest value
Category: allows you to group members into their own inspector area
Immersive Debugger (Devs Overview)
Okay, so up to this point, we’ve learned what the Immersive Debugger is and how to use the `DebugInspector` component within Unity game objects. This is great because it gives users more control over what is exposed and what isn’t. But what about giving developers even more power? For instance, wouldn’t it be useful to use this right after implementing a new feature, without having to wait for a UI designer to finish their work? I know it sounds cool—and it really is cool—which is what I want to show you next.
As a developer, you have access to various options. Just like I described in the Non-Devs section, you can handle this within code or, even better, combine the `DebugInspector` with your own `DebugMember` attributes. But what exactly are these `DebugMembers`? Let me explain how they work by showing you a snippet of what I did in my last dev video.
// measure tape rendering variables
[DebugMember(Category = "MeasureTapeFeature", Tweakable = true, Min = 0.025f, Max = 0.1f)]
[SerializeField] private float tapeWidth = 0.01f;

[DebugMember(Category = "MeasureTapeFeature", Tweakable = true, Min = 0.005f, Max = 0.1f)]
[SerializeField] private float measurementInfoLength = 0.2f;

// controller measuring tape line area variables
[DebugMember(Category = "MeasureTapeFeature", GizmoType = DebugGizmoType.Axis)]
[SerializeField] private Transform leftControllerTapeArea;

[DebugMember(Category = "MeasureTapeFeature", GizmoType = DebugGizmoType.Axis)]
[SerializeField] private Transform rightControllerTapeArea;

// tape lines clearing method
[DebugMember(Category = "MeasureTapeFeature")]
public void ClearAllLines()
{
    foreach (var tapeLine in savedTapeLines)
    {
        Destroy(tapeLine.TapeLine);
    }
    savedTapeLines.Clear();
}
All right, let’s break down what we have above. The `DebugMember` attribute is similar to what we used in the Unity Inspector before, but here we’re decorating each member with this attribute and a range of options. The `tapeWidth` and `measurementInfoLength` variables are of type `float`. These variables help the Productivity App determine the thickness of lines and the offset of the measurement label. By setting `Tweakable=true`, we’re instructing Immersive Debugger to add these fields as editable sliders when we run it. The `Category` is used for groupings in the runtime inspector, and `Min` and `Max` define the value constraints.
Next, we have `leftControllerTapeArea` and `rightControllerTapeArea`, both of which are transforms. We set them to have a Debug Gizmo of type `Axis`, so when the Immersive Debugger runs, you’ll have the option to toggle the visibility of these on and off, which will render an Axis Gizmo for each.
Lastly, `ClearAllLines` is a method. It might seem surprising, but you can also expose methods. In this case, we’re telling Immersive Debugger to expose this method, which will create a button named “ClearAllLines,” allowing you to execute it directly.
Immersive Debugger Console Logs
A feature I was super excited about when testing Immersive Debugger was its logging capabilities. I can’t count how many times in my XR development career I’ve had to write a custom UI log to display debugging information at runtime—honestly, I’ve lost track. Anyway, Meta has included an exact replica of your Unity logs in Immersive Debugger, complete with debug info, debug warnings, debug errors, and even icons and stack traces that match what you see in Unity.
Fig 1.3 - Immersive Debugger Console Logs
So, how do you write to these logs? Here’s the best part: there’s no need for custom implementation or special logging methods like `YourLogger.Instance.LogInfo` or `MyCoolLogger.Instance.Log`. Instead, you simply use the built-in `Debug.Log`, `Debug.LogWarning`, and `Debug.LogError`. Below is an example I used when testing this functionality.
[DebugMember(Category = "MenuInteraction")]
private void AddLevelerFeature()
{
   Instantiate(levelerFeaturePrefab);
   Debug.Log("New leveler feature(tool) has been added");
}

[DebugMember(Category = "MenuInteraction")]
private void ClearAllTapeLines()
{
   MeasureTapeFeature.Instance.ClearAllLines();
   Debug.Log("All tape lines were removed");
}Fig 1.4 - Additional display logging options and custom logging integration
Well, that’s about everything I wanted to share with you today. I will also leave additional resources below which I recommend as you get into using this tool or others I recommend for fast iteration.
Resources:
Thanks Everyone and Happy XR coding! 😊
Dilmer